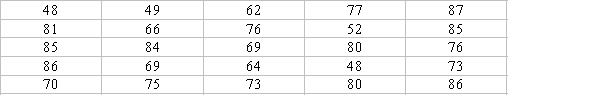
Below are skills test scores for applicants of a software engineering job. Put the data into a frequency distribution using intervals of size 8. Include columns for percentages and cumulative percentages.
Correct Answer:
Verified
Q24: How does a frequency polygon differ from
Q25: Table 2.2 Number of Prior Convictions among
Q26: Table 2.2 Number of Prior Convictions among
Q27: Table 2.2 Number of Prior Convictions among
Q28: Table 2.2 Number of Prior Convictions among
Q29: Table 2.2 Number of Prior Convictions among
Q30: Table 2.2 Number of Prior Convictions among
Q31: Table 2.2 Number of Prior Convictions among
Q32: Why do researchers commonly use intervals when
Q34: The frequency distribution below displays the distribution
Unlock this Answer For Free Now!
View this answer and more for free by performing one of the following actions

Scan the QR code to install the App and get 2 free unlocks

Unlock quizzes for free by uploading documents