The figure below shows the result of a price fixing scheme that raised price above competitive levels at point C to a price of $15 at point M.
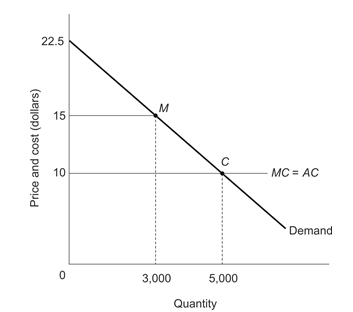
-By forming this price-fixing cartel, producers gained $__________ of producer surplus, while consumers lost $__________ of consumer surplus.
A) $15,000; $10,000
B) $15,000; $20,000
C) $20,000; $10,000
D) $20,000; $5,000
Correct Answer:
Verified
Q1: The cost and demand conditions for residential
Q2: The cost and demand conditions for residential
Q3: The cost and demand conditions for residential
Q5: refer to the following information:
A municipal water
Q6: refer to the following information:
A municipal water
Q7: refer to the following information:
A municipal water
Q8: refer to the following information:
A municipal water
Q9: refer to the following information:
A municipal water
Q10: refer to the following information:
A municipal water
Q11: refer to the following information:
A municipal water
Unlock this Answer For Free Now!
View this answer and more for free by performing one of the following actions

Scan the QR code to install the App and get 2 free unlocks

Unlock quizzes for free by uploading documents