The following figure shows the average revenue product (ARP) and marginal revenue product curves of monopoly for its only variable input, labor.
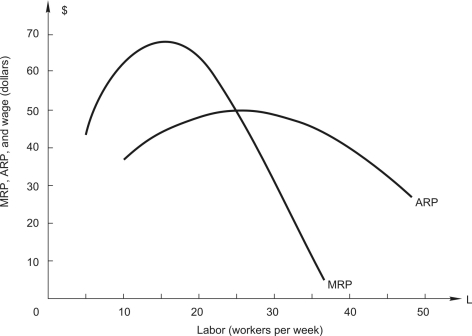
-If the wage is $10, the firm will hire __________ workers. Total revenue is $________ (hint: ARP = P(Q/L), total variable cost is $________. If total fixed cost is $550, the firm earns a profit of $________.
Correct Answer:
Verified
View Answer
Unlock this answer now
Get Access to more Verified Answers free of charge
Q42: The following figure shows demand, marginal revenue,
Q43: The following figure shows demand, marginal revenue,
Q44: The following figure shows demand, marginal revenue,
Q45: The following figure shows demand, marginal revenue,
Q46: The following figure shows the average revenue
Q48: The following figure shows the average revenue
Q49: The manager of a monopoly firm obtained
Q50: The manager of a monopoly firm obtained
Q51: The manager of a monopoly firm obtained
Q52: The estimated average variable cost function is
AVC
Unlock this Answer For Free Now!
View this answer and more for free by performing one of the following actions

Scan the QR code to install the App and get 2 free unlocks

Unlock quizzes for free by uploading documents