The following figure shows demand and marginal revenue for a firm that produces in two plants, A and B, the marginal cost curves of which are shown, respectively, as MCA and MCB.
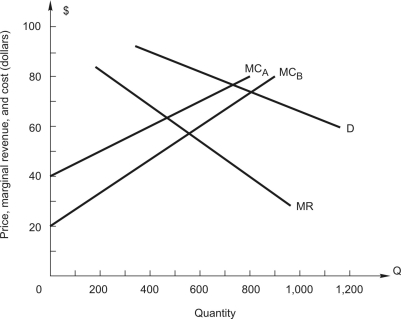
-Any output below ________ would all be produced in plant ______.
Draw in the total marginal cost curve and label it MCT.
Correct Answer:
Verified
Q58: A firm produces its output in two
Q59: A firm produces its output in two
Q60: A firm produces output in two plants,
Q61: A firm produces output in two plants,
Q62: A firm produces output in two plants,
Q63: A firm produces output in two plants,
Q64: A firm produces output in two plants,
Q66: The following figure shows demand and marginal
Q67: The following figure shows demand and marginal
Q68: The following figure shows demand and marginal
Unlock this Answer For Free Now!
View this answer and more for free by performing one of the following actions

Scan the QR code to install the App and get 2 free unlocks

Unlock quizzes for free by uploading documents