refer to the following figure:
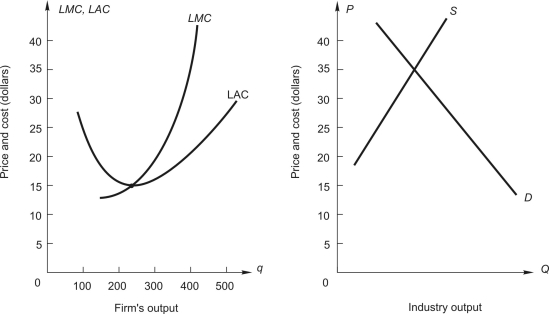 The graph on the left shows long-run average and marginal cost for a typical firm in a perfectly competitive industry. The graph on the right shows demand and long-run supply for an increasing-cost industry.
-How much profit will the firm earn?
A) zero
B) $2,600
C) $3,100
D) $3,750
E) $6,000
Correct Answer:
Verified
Q1: refer to the following figure:

Q3: refer to the following:
A consulting company estimated
Q4: refer to the following:
A consulting company estimated
Q5: refer to the following:
Consider a competitive industry
Q6: refer to the following:
Consider a competitive industry
Q7: refer to the following:
Consider a competitive industry
Q8: refer to the following:
Consider a competitive industry
Q9: refer to the following:
Consider a competitive industry
Q10: refer to the following:
Consider a competitive industry
Q11: refer to the following:
Consider a competitive industry
Unlock this Answer For Free Now!
View this answer and more for free by performing one of the following actions

Scan the QR code to install the App and get 2 free unlocks

Unlock quizzes for free by uploading documents