The figure below shows a long-run industry supply curve (SLR) and the demand curve (D) facing the competitive industry. The firms in this industry employ inputs of varying quality and productivity.
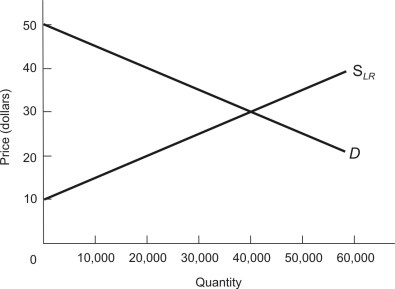
-The long-run marginal cost of producing the 20,000th unit of output is $________.
Correct Answer:
Verified
Q47: A competitive firm has estimated its average
Q48: A competitive firm has estimated its average
Q49: A competitive firm has estimated its average
Q50: A competitive firm has estimated its average
Q51: A competitive firm has estimated its average
Q53: The figure below shows a long-run industry
Q54: The figure below shows a long-run industry
Q55: The figure below shows a long-run industry
Q56: The figure below shows a long-run industry
Q57: The figure below shows a long-run industry
Unlock this Answer For Free Now!
View this answer and more for free by performing one of the following actions

Scan the QR code to install the App and get 2 free unlocks

Unlock quizzes for free by uploading documents