The following graph shows a firm's long-run average and marginal cost curves.
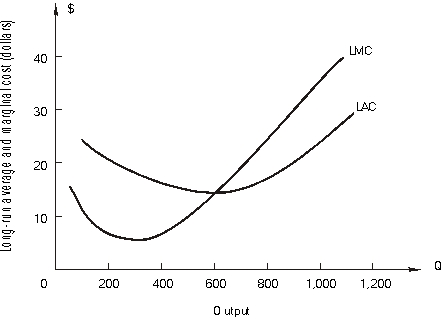
-From zero to 600 units of output __________ exist. Beyond 600, ________________ exist. Suppose the firm decides to build a plant to produce 900 units of output at the least possible cost. After the plant is built the firm is in the short run with short-run average and marginal cost curves of ATC and MC. (ATC and MC are not shown in the figure.)
Correct Answer:
Verified
View Answer
Unlock this answer now
Get Access to more Verified Answers free of charge
Q41: Using the above table, answer the following
Q42: Using the above table, answer the following
Q43: Using the above table, answer the following
Q44: Using the above table, answer the following
Q45: Using the above table, answer the following
Q47: The following graph shows a firm's long-run
Q48: The following graph shows a firm's long-run
Q49: A firm increases its usage of all
Q50: A firm increases its usage of all
Q51: A firm increases its usage of all
Unlock this Answer For Free Now!
View this answer and more for free by performing one of the following actions

Scan the QR code to install the App and get 2 free unlocks

Unlock quizzes for free by uploading documents