Use the following graph showing the marginal benefit and marginal cost curves for activity A to answer the following questions.
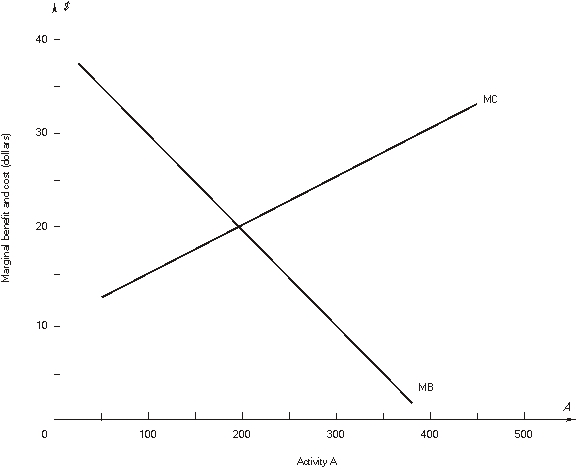
-If 100 units of A are chosen, net benefit will increase by $_________ if one _________ unit of A is chosen.
Correct Answer:
Verified
Q8: The marginal benefit and marginal cost functions
Q9: The marginal benefit and marginal cost functions
Q10: The marginal benefit and marginal cost functions
Q11: Use the following graph showing the marginal
Q12: Use the following graph showing the marginal
Q14: Fill in the blanks in the following
Q15: Fill in the blanks in the following
Q16: Fill in the blanks in the following
Q17: Fill in the blanks in the following
Q18: Activity A has the following marginal (MB)
Unlock this Answer For Free Now!
View this answer and more for free by performing one of the following actions

Scan the QR code to install the App and get 2 free unlocks

Unlock quizzes for free by uploading documents