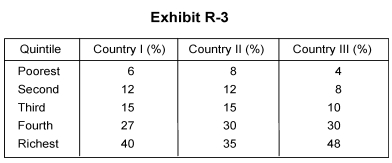
-Exhibit R-3 shows the percentage of income received by each population quintile. From this chart we can conclude
A) Country I has the most unequal income distribution
B) Country III has the most equal income distribution
C) Country II has the most unequal income distribution
D) Country II has the most equal income distribution
E) Country III has a more equal income distribution than Country II
Correct Answer:
Verified
Q29: Negative income taxes have been a feature
Q30: A reverse tax, or negative income tax,
Q31: Wealth and income are two different terms
Q32: According to John Rawls, a "veil of
Unlock this Answer For Free Now!
View this answer and more for free by performing one of the following actions

Scan the QR code to install the App and get 2 free unlocks

Unlock quizzes for free by uploading documents