Multiple Choice
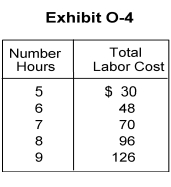
-In Exhibits O-4 and 0-3, using the data in Exhibit O-4, the labor supply curve in ExhibitO-3 would be shown in graph
A) I
B) II
C) III
D) IV
E) unable to be determined from this information
Correct Answer:
Verified
Related Questions

