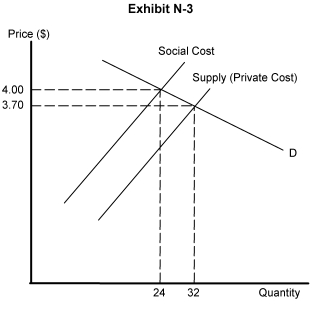
-Exhibit N-3 depicts a market showing the demand curve for a good and two supply curves, one reflecting the industry's private costs; the other reflecting the costs of resources to society producing the good. It is clear from this representation of the market that the socially optimum price and output would be
A) $4.00 and 32
B) $4.00 and 24
C) $3.70 and 32
D) $3.70 and 24
E) $3.85 and 28
Correct Answer:
Verified
Q60: When negative externalities are present, the firm's
Q61: The social (or true) cost of producing
Q62: Social cost is
A) private cost minus external
Q63: Q64: Q66: Q67: Market failure implies that Q68: The government is seen by many economists Q69: The creation of private property rights corrects Q70: Unlock this Answer For Free Now! View this answer and more for free by performing one of the following actions Scan the QR code to install the App and get 2 free unlocks Unlock quizzes for free by uploading documents![]()
![]()
![]()
A) in the real![]()

