Multiple Choice
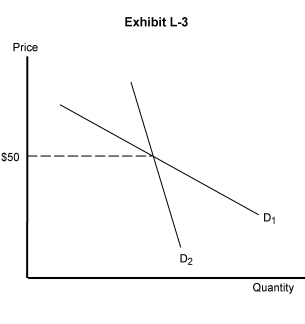
-In Exhibit L-3, representing the demand curves that make up the kinked demand curve, D2 is the
A) demand curve applicable to any price increase above $50
B) demand curve applicable to any price decrease below $50
C) demand curve facing firms when a cartel is formed
D) market demand curve
E) demand curve facing the price leader
Correct Answer:
Verified
Related Questions
Q77: The text describes various pricing strategies that
Q78: In a price leadership oligopoly model,
A) a
Q79: According to the text, why would firms
Q80: What assumption(s) is (are) necessary to generate

