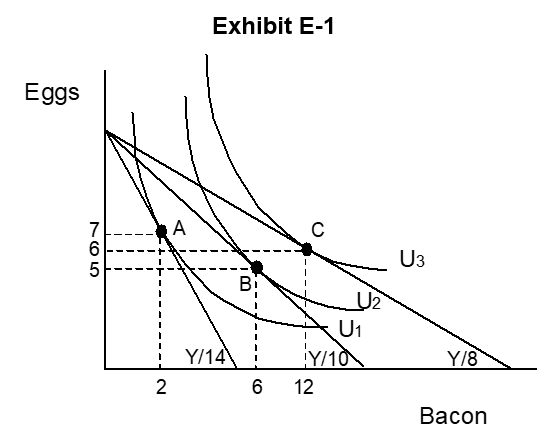
-Referring to Exhibit E-1, where Y represents income and Y/14, Y/10, and Y/8 are the values for the intercepts of the budget lines along the horizontal axis, a point (quantity,price) on the demand curve for bacon would be
A) 14, $7
B) 10, $5
C) 2, $7
D) 6, $10
E) 6, $5
Correct Answer:
Verified
Q16: The water and diamond paradox can be
Q17: Moving from one curve to another in
Q18: The budget constraint 12,000 = 2X +
Q19: A change in a consumer's feelings about
Q20: As population of a region increases, the
Q22: Sam McGarrity inherited $500,000 upon his favorite
Q23: You have one free movie to give
Unlock this Answer For Free Now!
View this answer and more for free by performing one of the following actions

Scan the QR code to install the App and get 2 free unlocks

Unlock quizzes for free by uploading documents