Multiple Choice
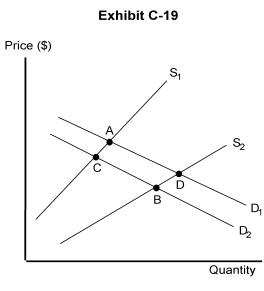
-In Exhibit C-19, the shift of the demand curve is best explained by a change in
A) the quantity demanded
B) resources prices
C) prices
D) the prices of other goods
E) the number of demanders and suppliers
Correct Answer:
Verified
Related Questions
Q126: Which of the following best explains the
Q127: If both supply and demand decrease and
Q128: If both supply and demand decrease, which
Q129: Which of the following is true about
Q130: Equilibrium price is best described as the
Unlock this Answer For Free Now!
View this answer and more for free by performing one of the following actions

Scan the QR code to install the App and get 2 free unlocks

Unlock quizzes for free by uploading documents