Multiple Choice
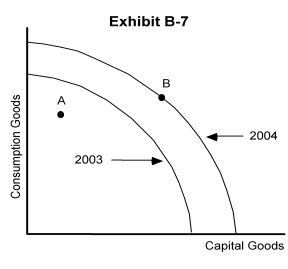
-Exhibit B-7 shows the production possibilities curves for a country for the years 2003 and 2004. Which of the following could have caused this shift in the production possibility curves?
A) a decrease in unemployment
B) a decline in technology
C) an increase in the quantity of capital goods used as a resource
D) a natural disaster
E) more efficient production
Correct Answer:
Verified
Related Questions

