Use the following information for questions:
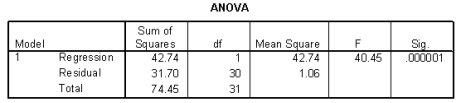
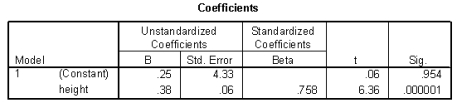
The heights (in inches) and foot lengths (in centimeters) of 32 college men were used to develop a model for the relationship between height and foot length. The scatterplot shows that a linear model is appropriate. SPSS output is provided below. 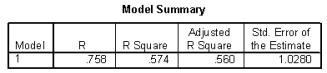
-Max is 70 inches tall. If a 95% prediction interval for his foot length were calculated, the width of this interval would _______ with respect to the interval from question 99.
A) increase
B) decrease
Correct Answer:
Verified
Q94: Use the following information for questions:
The
Q95: Use the following information for questions:
The
Q96: Use the following information for questions:
Q97: Use the following information for questions:
Q98: Use the following information for questions:
Q100: Use the following information for questions:
Can an
Q101: Use the following information for questions:
Can an
Q102: Use the following information for questions:
Can an
Q103: Use the following information for questions:
Can an
Q104: Consider the following plot of residuals versus
Unlock this Answer For Free Now!
View this answer and more for free by performing one of the following actions

Scan the QR code to install the App and get 2 free unlocks

Unlock quizzes for free by uploading documents