The scatterplot below shows students' heights (y) versus father's heights (x) for a sample of 173 college students. The symbol "+" represents a male student and the symbol "o" represents a female student.
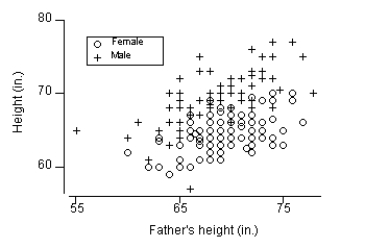 A linear regression equation is determined for the relationship between female students' heights and their father's heights and, separately, one for male students and their fathers. How do the y-intercepts compare for these two regression equations?
Correct Answer:
Verified
View Answer
Unlock this answer now
Get Access to more Verified Answers free of charge
Q50: Use the following information for questions:
Q51: Use the following information for questions:
Q52: Use the following information for questions:
Q53: Use the following information for questions:
Q54: Use the following information for questions:
Q56: Use the following information for questions:
The
Q57: Use the following information for questions:
The
Q58: Use the following information for questions:
The
Q59: Use the following information for questions:
The
Q60: Use the following information for questions:
The
Unlock this Answer For Free Now!
View this answer and more for free by performing one of the following actions

Scan the QR code to install the App and get 2 free unlocks

Unlock quizzes for free by uploading documents