The following output is for a simple regression in which y = grade point average (GPA) and x = number of classes skipped in a typical week. The results were determined using self-reported data for a sample of n = 1,673 at a large northeastern university.
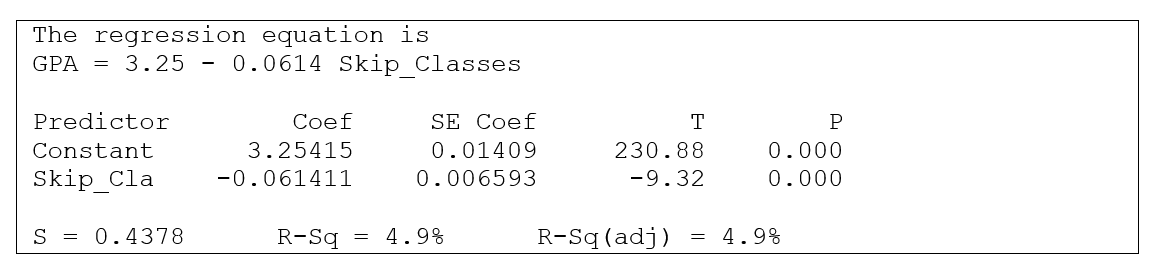 What value is given in the output for R2? Based on this value, explain whether the association between GPA and classes skipped per week is a strong association or a weak association.
Correct Answer:
Verified
View Answer
Unlock this answer now
Get Access to more Verified Answers free of charge
Q73: A researcher reports that the correlation between
Q74: A reviewer rated a sample of fifteen
Q75: Consider the following graph: Q76: Which of the following is a deterministic Q77: The correlation between father's heights and student's Q79: Use the following information for questions: Q80: Use the following information for questions: Q81: Use the following information for questions: Q82: Use the following information for questions: Q83: A counselor at a weight-loss clinic wishes![]()
Unlock this Answer For Free Now!
View this answer and more for free by performing one of the following actions

Scan the QR code to install the App and get 2 free unlocks

Unlock quizzes for free by uploading documents