A scatterplot of the self-reported weights (y variable) and self-reported heights (x variable) for 176 college students follows. 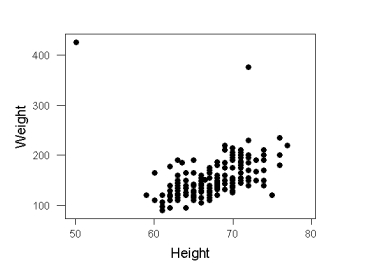 What is the main difficulty with using a regression line to analyze these data?
A) Presence of one or more outliers
B) Inappropriately combining groups
C) Curvilinear data
D) Response variable is not quantitative
Correct Answer:
Verified
Q80: Use the following information for questions:
Q81: Use the following information for questions:
Q82: Use the following information for questions:
Q83: A counselor at a weight-loss clinic wishes
Q84: A psychology student wishes to determine the
Q86: A scatterplot of the price of a
Q87: A researcher would like to study the
Q88: Based on 1988 census data for the
Q89: What is the effect of an outlier
Q90: A scatter plot of number of teachers
Unlock this Answer For Free Now!
View this answer and more for free by performing one of the following actions

Scan the QR code to install the App and get 2 free unlocks

Unlock quizzes for free by uploading documents