Use the following information for questions:
The following boxplot gives the distribution of the ratings of a new brand of peanut butter for 50 randomly selected consumers (100 points possible with higher points corresponding to a more favorable rating) . 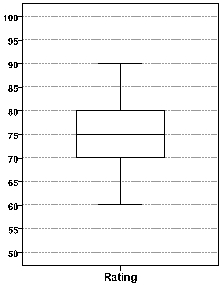
-The median is
A) 60 points.
B) 70 points.
C) 75 points.
D) 80 points.
Correct Answer:
Verified
Q51: Use the following information for questions:
The
Q52: Use the following information for questions:
The
Q53: Use the following information for questions:
The
Q54: Use the following information for questions:
The
Q55: Use the following information for questions:
The
Q57: Use the following information for questions:
The
Q58: A recent study was conducted to compare
Q59: An outlier is a data value that
A)
Q60: Which statistic is not resistant to an
Q61: Which one of these statistics is unaffected
Unlock this Answer For Free Now!
View this answer and more for free by performing one of the following actions

Scan the QR code to install the App and get 2 free unlocks

Unlock quizzes for free by uploading documents