Multiple Choice
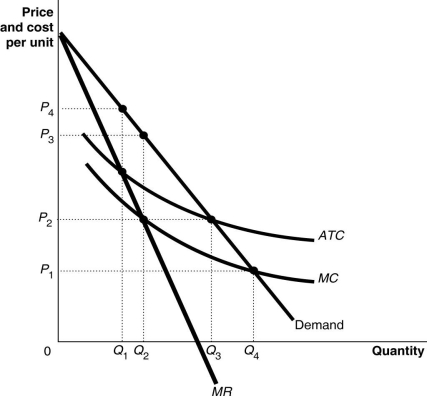
Figure 15-19 shows the cost and demand curves for the Erickson Power Company.
-Refer to Figure 15-19. What is the economically efficient output level and what is the price at that level?
A) Q4, P1
B) Q3, P2
C) Q2, P2
D) Q2, P3
Correct Answer:
Verified
Related Questions

