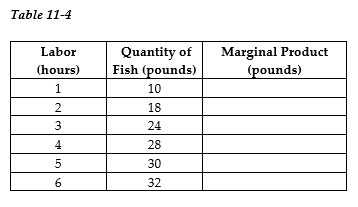
-Refer to Table 11-4. The table above shows the following relationship between hours spent fishing and the quantity of fish caught for Juan, a commercial fisherman.
a. Complete the Marginal Product column in Table 11-4.
b. Characterize the production function, i.e. does the production function display increasing marginal returns, diminishing marginal returns, etc.
c. Using the data above, graph Juan's marginal product curve. Be sure to label the horizontal and vertical axes. Is your graph consistent with your answer to part (b)? Explain.
d. Juan uses the following inputs for fishing - a small wooden boat (B), a fishing pole (P) and of course, his labor (L). Treating the boat and the fishing pole as fixed inputs and using the data above, graph Juan's Total Product of Labor curve. Be sure to label the horizontal and vertical axes.
e. The opportunity cost of Juan's time is $8 per hour. If Juan receives $2 per pound for his fish, what is the optimal number of hours he should spend fishing? Explain how you arrived at your answer. Hint: Recall marginal benefit and marginal cost analysis.
Correct Answer:
Verified
b. The production displays diminishing...
View Answer
Unlock this answer now
Get Access to more Verified Answers free of charge
Q2: When oil companies implemented changes which allowed
Q3: Golda Rush quit her job as a
Q4: Golda Rush quit her job as a
Q5: Vipsana's Gyros House sells gyros. The cost
Q6: Q8: Fill in the missing values in the Q9: When deciding on how much oil to Q10: Suppose the total cost of producing 40,000 Q11: Q12: Unlock this Answer For Free Now! View this answer and more for free by performing one of the following actions Scan the QR code to install the App and get 2 free unlocks Unlock quizzes for free by uploading documents![]()
![]()
![]()

