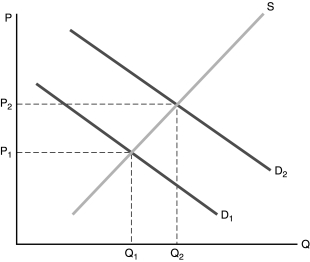
Solved

Figure 8.2 -Refer to Figure 8.2. the Market Equilibrium Is Q1. Point

Question 24

Multiple Choice

  Figure 8.2 -Refer to Figure 8.2. The market equilibrium is Q<sub>1</sub>. Point Q<sub>2 </sub>represents the optimal point of production. This indicates that A)  the good represented here is a public good. B)  regressive taxation of the product would result in the most efficient outcome. C)  consumption of the good generates a positive externality. D)  consumption of the good generates a negative externality. Figure 8.2
-Refer to Figure 8.2. The market equilibrium is Q1. Point Q2 represents the optimal point of production. This indicates that


A) the good represented here is a public good.
B) regressive taxation of the product would result in the most efficient outcome.
C) consumption of the good generates a positive externality.
D) consumption of the good generates a negative externality.

Correct Answer:

verifed

Verified

Unlock this answer now
Get Access to more Verified Answers free of charge

Related Questions

Unlock this Answer For Free Now!

View this answer and more for free by performing one of the following actions

qr-code

Scan the QR code to install the App and get 2 free unlocks

upload documents

Unlock quizzes for free by uploading documents