Table 1
A sample of 80 company employees is grouped into a table based on their weekly salaries:
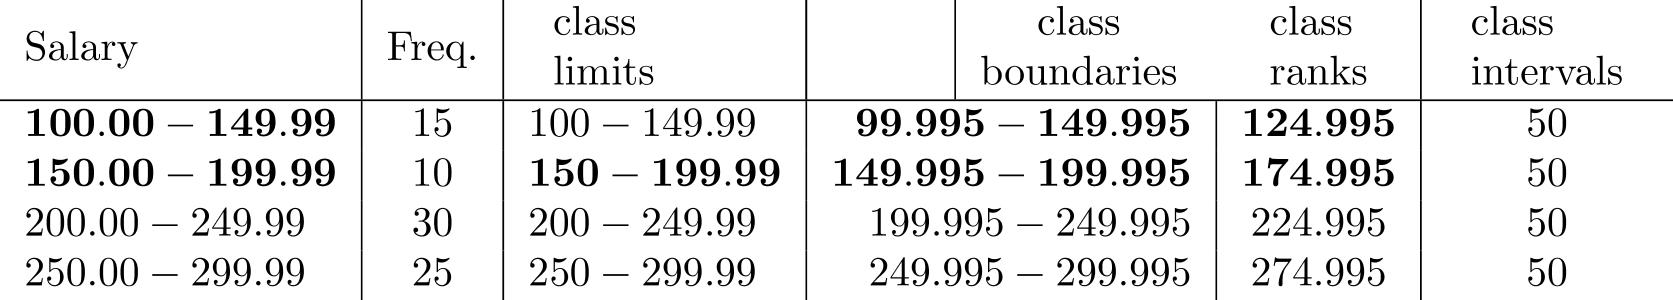
-From the data in Table 1, construct the cumulative "less than" distribution.
Correct Answer:
Verified
Q7: We can show the proportion of values
Q8: In order to present numerical categories of
Q9: Which of the following would be a
Q10: Given the frequency distribution: Q11: Table 1 Q13: Table 1 Q14: Table 1 Q15: Solve the problem. Q16: Solve the problem. Q17: The following are three daily pizza![]()
A sample of 80 company employees
A sample of 80 company employees
A sample of 80 company employees
-Given the class marks 22,
-Given the class boundaries
Unlock this Answer For Free Now!
View this answer and more for free by performing one of the following actions

Scan the QR code to install the App and get 2 free unlocks

Unlock quizzes for free by uploading documents