Table 2
Two companies have the following sales results for a particular month.
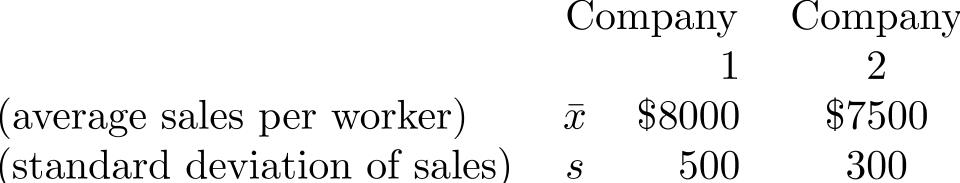
-Use the data in Table 2 to solve the following:
Give the coefficient of variation of the sales of each of the two companies.
Correct Answer:
Verified
1. c...
View Answer
Unlock this answer now
Get Access to more Verified Answers free of charge
Q19: The number of sales of homes having
Q20: The number of sales of homes having
Q21: Table 2
Two companies have the following
Q22: Table 2
Two companies have the following
Q23: Table 2
Two companies have the following
Q25: How does the interquartile range compare to
Q26: How does the interquartile range compare to
Q27: The prices (in dollars) of 16
Q28: The prices (in dollars) of 16
Q29: The prices (in dollars) of 16
Unlock this Answer For Free Now!
View this answer and more for free by performing one of the following actions

Scan the QR code to install the App and get 2 free unlocks

Unlock quizzes for free by uploading documents