The graph shows the distribution of a continuous random variable that takes on values on the continuous interval from -2 to 2 . Find the probability that this random variable will take on the value indicated.
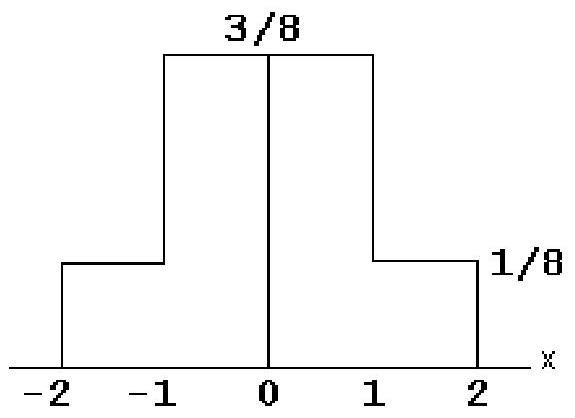
-Between and
Correct Answer:
Verified
Q17: The probability of obtaining exactly 20
Q18: The problem that is solved by
Q19: In a binomial distribution with 10
Q20: If
Q21: The graph shows the distribution of a
Q23: The graph shows the distribution of a
Q24: Find the standard normal-curve area indicated
Q25: Find the standard normal-curve area indicated
Q26: Find the standard normal-curve area indicated
Q27: If a random variable has the
Unlock this Answer For Free Now!
View this answer and more for free by performing one of the following actions

Scan the QR code to install the App and get 2 free unlocks

Unlock quizzes for free by uploading documents