Table 17.3
The table below gives the number of housing starts and the unemployment rates for a sequence of quarters:
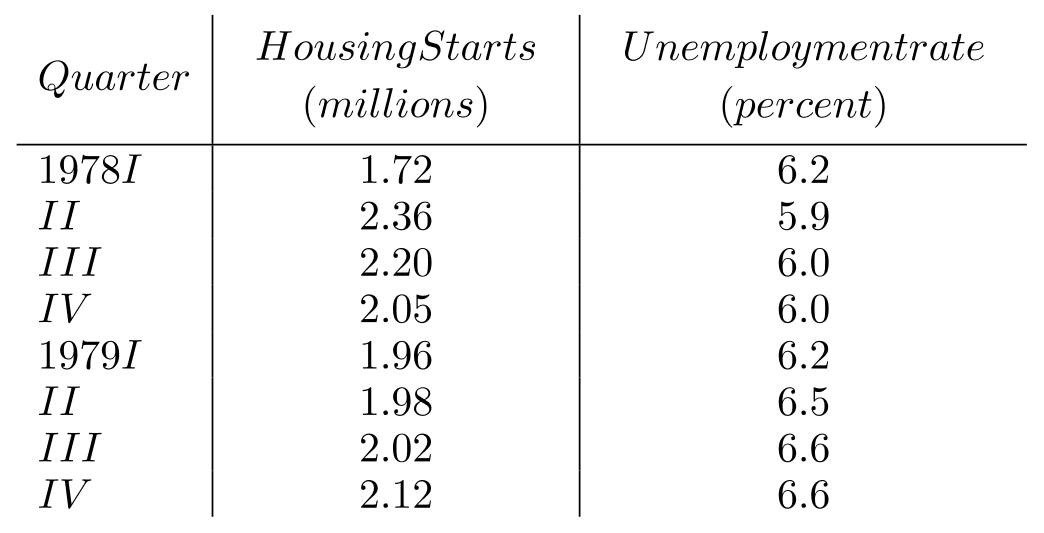
-Use Table 17.3 to solve the following:
a. Calculate the correlation coefficient.
b. What is the proportion of the total variation in unemployment rates that is explained by the number of housing starts?
c. Test the null hypothesis that at .
Correct Answer:
Verified
b.
c.
View Answer
Unlock this answer now
Get Access to more Verified Answers free of charge
Q5: The correlation coefficient is equal to
A) the
Q6: If the hypothesis that
Q7: Table 17.1
The mathematics S.A.T. scores and
Q8: In a multiple regression problem, the
Q9: Table 17.2
Below is a list of
Q11: A financial economist wants to evaluate
Q12: For two sets of data
Q13: The variables circulation
Q14: If
Q15: In order to find the correlation coefficient,
Unlock this Answer For Free Now!
View this answer and more for free by performing one of the following actions

Scan the QR code to install the App and get 2 free unlocks

Unlock quizzes for free by uploading documents