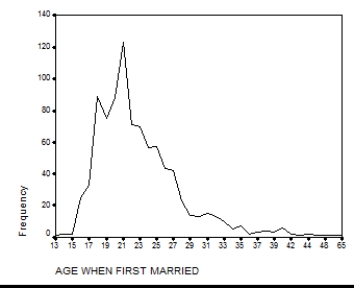
Presented below is a chart and a portion of the data for 550 respondents which were used to construct it.What is another type of graph that you can use to display this information? Construct this graph using the data below with the frequencies placed along the vertical axis.

Correct Answer:
Verified
Q43: Consider the table below obtained from the
Q44: Consider the information in the table below.Construct
Q45: According to the table below,how many people
Q46: According to this table,what proportion of respondents
Q47: What other type of graph could be
Q49: Construct either a bar chart or a
Q50: Using the following information from the U.S.Census
Q51: Using the following information from the U.S.Census
Q52: Would a bar chart or a histogram
Q53: Considering the information in the table below,what
Unlock this Answer For Free Now!
View this answer and more for free by performing one of the following actions

Scan the QR code to install the App and get 2 free unlocks

Unlock quizzes for free by uploading documents