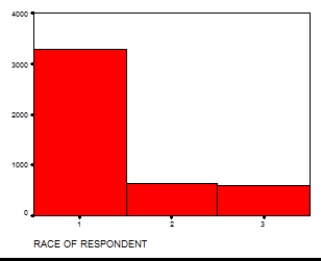
The following graph depicts the number of respondents by racial group,where 1 = white,2 = black,and 3 = other.Explain why this choice of graphic is or is not appropriate for these data.
Correct Answer:
Verified
View Answer
Unlock this answer now
Get Access to more Verified Answers free of charge
Q54: Considering the information provided in the table
Q55: Considering the information in the table below,what
Q56: Explain how cumulative frequency distributions are obtained.What
Q57: Fill in the empty cells in the
Q58: Construct a cumulative frequency distribution using the
Q59: Refer to the table below and construct
Q60: Using the following information from the U.S.Census
Q62: Explain why the following statement is true:
Q63: Which graphic device would be most appropriate
Q64: Which graphic device would be most appropriate
Unlock this Answer For Free Now!
View this answer and more for free by performing one of the following actions

Scan the QR code to install the App and get 2 free unlocks

Unlock quizzes for free by uploading documents