Which of the following is the best interpretation of the graph below of mussel size (x-axis) versus energy gain (line graph, left y-axis) , and number of mussels eaten per day (histogram, right y-axis) ? 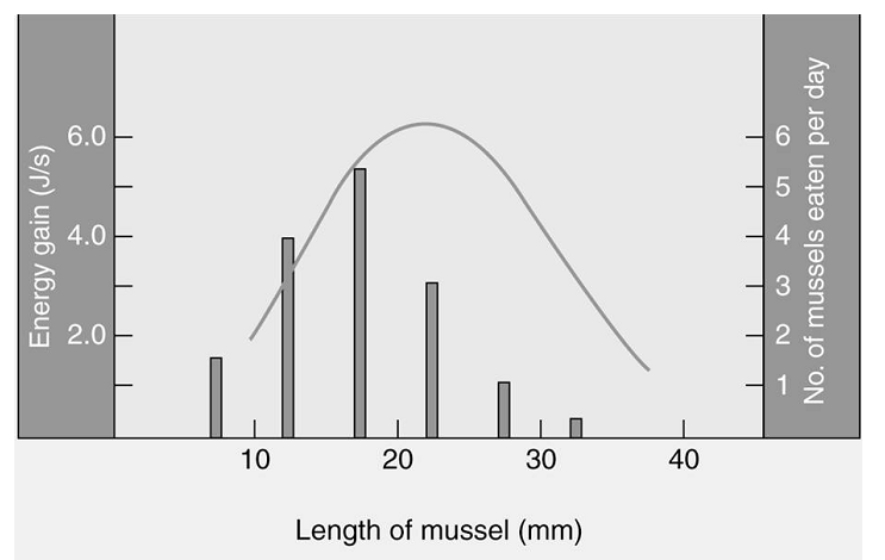
A) Mussels are selected as food sources by crabs.
B) Crabs select mussels in a way that maximizes their energy gain.
C) Mussel size does not seem to be a good predictor as to which mussel hungry crabs will select.
D) Crabs tend to consume most of the largest mussels.
E) Crabs prefer the mussels with the smallest length for their food resources.
Correct Answer:
Verified
Q1: Foraging bees communicate with other bees in
Q2: Which of the following is an appropriate
Q3: A friend of yours is wondering about
Q5: Your study buddy asks, "would you please
Q6: Pea fowl (peacocks and peahens) show sexual
Q7: The development of normal maternal behavior in
Q8: It is 6:00 PM and the
Q9: In which of the following examples has
Q10: Which of the following statements comparing the
Q11: Male fruit flies perform a complex mating
Unlock this Answer For Free Now!
View this answer and more for free by performing one of the following actions

Scan the QR code to install the App and get 2 free unlocks

Unlock quizzes for free by uploading documents