The figure below shows data for three different characteristics of blood vessels (orange, blue and green curves, respectively) . What is correct to conclude from this graph? 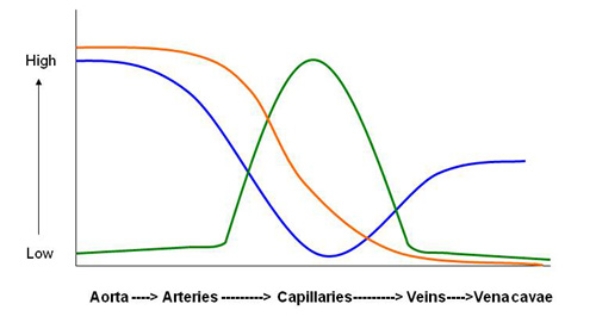
A) The exchange of nutrients and respiratory gases between the blood and the interstitial fluid occurs where the blue curve plateaus out on the right.
B) Blood is propelled at the maximum of the orange curve by forceful closing of the aortic valve.
C) The orange curve represents the velocity of the blood flowing through each class of blood vessel.
D) The blue curve represents the average blood pressure in each class of blood vessel.
E) The green curve represents the total cross-sectional area of each class of blood vessel.
Correct Answer:
Verified
Q33: What would happen if your SA node
Q34: Refer to the diagram below. 
Q35: In the blood clotting cascade mechanism, what
Q36: The cardiac output is the volume of
Q37: During your annual physical, a nurse takes
Q38: The brachial artery is the major artery
Q39: You are taking a lab practical exam,
Q40: If an arteriole has a radius
Q42: Susie just squished a cockroach and its
Q43: A mountain climber was rescued after spending
Unlock this Answer For Free Now!
View this answer and more for free by performing one of the following actions

Scan the QR code to install the App and get 2 free unlocks

Unlock quizzes for free by uploading documents