Which graph below best represents the change in the proportion of unstable (parent) radioactive isotopes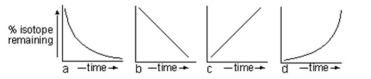 with time?
A) Graph a
B) Graph b
C) Graph c
D) Graph d
Correct Answer:
Verified
Q7: Carefully examine the relative positions of the
Q8: Use the diagram below to answer the
Q9: Use the diagram below to answer the
Q10: Use the diagram below to answer the
Q11: Using the diagram below, what is the
Q13: Which geologic time principle places events in
Q14: Which geologic time principle states that older
Q15: Why did Steno propose what eventually became
Q16: Why did Hutton propose what eventually became
Q17: What must be true of a rock
Unlock this Answer For Free Now!
View this answer and more for free by performing one of the following actions

Scan the QR code to install the App and get 2 free unlocks

Unlock quizzes for free by uploading documents