Multiple Choice
Use the following diagram to answer this question.
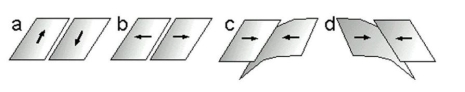
-Which of the images above best represents the plate boundary between the North American and Pacific plates along the San Andreas Fault?
A) Diagram a
B) Diagram b
C) Diagram c
D) Diagram d
Correct Answer:
Verified
Related Questions
Q9: Use the map-view diagram of a group
Q10: Use the map-view diagram of a group
Q11: Which graph best shows how the depth
Q12: Use the following diagram to answer this
Q13: Use the following diagram to answer this
Q15: Use the following diagram to answer this
Q16: The magnetic North Pole migrated northward from

