What time of year is represented by the global insolation data shown in the diagram below? 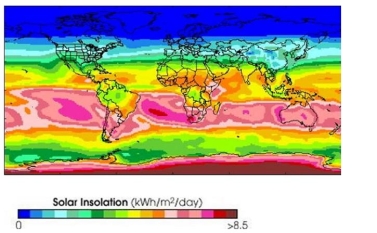
A) January
B) July
C) No way to tell
Correct Answer:
Verified
Q8: Analyze the map and select the proper
Q9: Analyze the map and select the proper
Q10: Based on this graph of the number
Q11: Which diagram best summarizes the structure of
Q12: Which of these diagrams best illustrates the
Q14: How would an increase in rotational tilt
Q15: According to the diagram below, what location
Q16: What would happen to the seasons if
Q17: According to the diagram below, which statement
Q18: How do scientists estimate the age of
Unlock this Answer For Free Now!
View this answer and more for free by performing one of the following actions

Scan the QR code to install the App and get 2 free unlocks

Unlock quizzes for free by uploading documents