Multiple Choice
(a) 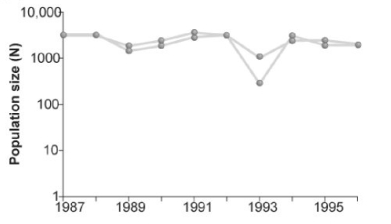
(b) 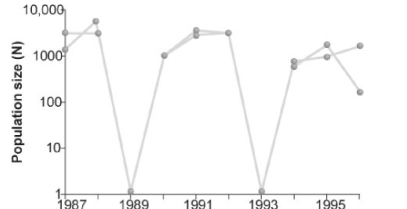
Figure 51.9
-Which of the two graphs in the figure above shows a population of organisms that has a strong population cycle?
A) a
B) b
C) both show identical cycles
Correct Answer:
Verified
Related Questions
(a)
(b)
Figure 51.9
-Which of the two graphs in the figure above shows a population of organisms that has a strong population cycle?
A) a
B) b
C) both show identical cycles
Correct Answer:
Verified

