Figure 55.3 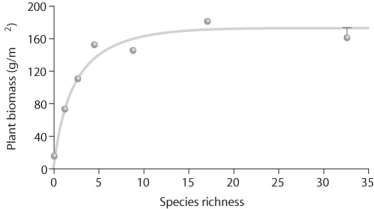
-Upon looking at Figure 55.3 regarding Tilman's experiments,what can you conclude about the data?
A) As species richness changes,plant biomass remains consistent.
B) As species richness increases,plant biomass increases.
C) As species richness increases,plant biomass increases and then levels off.
D) As species richness decreases,plant biomass increases.
Correct Answer:
Verified
Q1: Figure 55.4 Q2: Figure 55.2 Q6: Figure 55.2 Q8: In a debate about the destruction of Q9: Q12: Figure 55.2 Q12: If the last remaining population of a Q15: How can biodiversity affect the way we Q16: Figure 55.2 Q17: Unlock this Answer For Free Now! View this answer and more for free by performing one of the following actions Scan the QR code to install the App and get 2 free unlocks Unlock quizzes for free by uploading documents![]()
![]()
![]()
![]()
![]()
![]()
![]()

