Multiple Choice
Figure 55.5 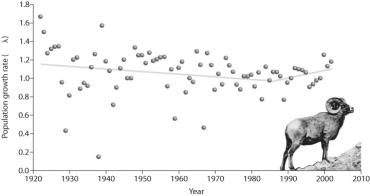
-According to the figure above,what is the least likely explanation for the data after 1985?
A) emigration
B) immigration
C) introduction of new individuals to the population
D) increased resources in the area
Correct Answer:
Verified
Related Questions
Q24: Figure 55.9 Q24: What is the main difference between sustainable Q25: Which of the following statements regarding extinction Q27: Figure 55.5 Q30: On Easter Island,data show that it was Q30: You discover,in your massive 2000-hectare forest,a species Unlock this Answer For Free Now! View this answer and more for free by performing one of the following actions Scan the QR code to install the App and get 2 free unlocks Unlock quizzes for free by uploading documents![]()
![]()

