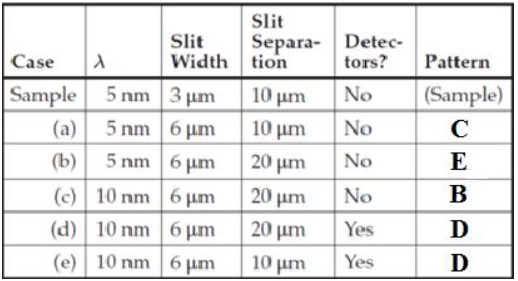
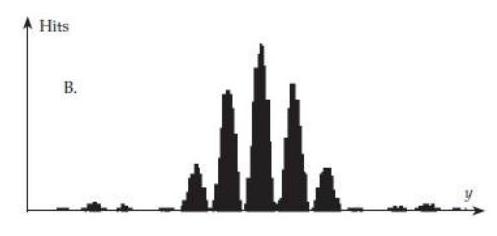
Figure Q5.9 displays a sample simulated interference pattern for a quanton-at-a-time interference experiment (the graph shows the number of quanton detection events versus position) followed by five interference patterns labeled A through E. Each table row below describes a set of parameters that will create one of the displayed patterns (the first row shows the parameters that display the "Sample" pattern). The slit separation stated is a center-to-center distance. The table rows are organized so that each set of parameters differs from the previous one by a change in only one value. The "Detectors" column refers to whether there are proximity detectors operating at the slits. Your task is to write the appropriate letter in the table's right-most column. You might use some letters more than once. (Thanks to David Tanenbaum and Jason Evans for developing this exercise.)

A.

B.
C.
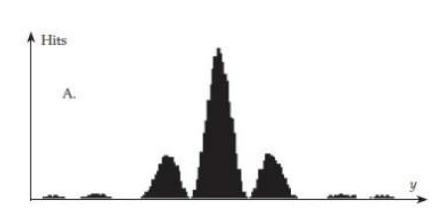
D.

E.
Correct Answer:
Verified
Q75: Consider the experimental evidence we have discussed
Q76: Consider the experimental evidence we have discussed
Q77: Consider the experimental evidence we have discussed
Q78: Consider the experimental evidence we have discussed
Q79: Consider the experimental evidence we have discussed
Q81: The point toward which compasses on the
Q82: Imagine a small magnet (with its north
Q83: Imagine a small magnet with its north
Q84: It is possible with appropriately shaped external
Q85: The direction of the net force on
Unlock this Answer For Free Now!
View this answer and more for free by performing one of the following actions

Scan the QR code to install the App and get 2 free unlocks

Unlock quizzes for free by uploading documents