Consider the following dotplots of bowling scores for 15 games by three different bowlers:
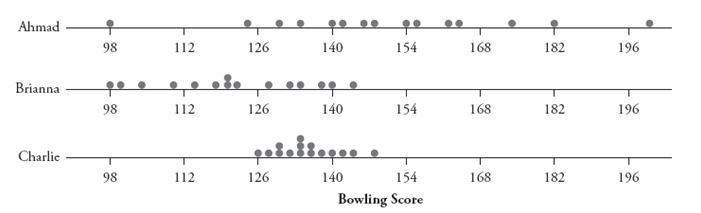 a. Which bowler tends to have the highest scores? (Do not provide explanations or calculations.)
b. Which bowler tends to have the lowest scores? (Do not provide explanations or calculations.)
c. Which bowler has the most consistency in his or her scores? (Do not provide explanations or calculations.)
d. Which bowler has the least consistency in his or her scores? (Do not provide explanations or calculations.)
Correct Answer:
Verified
...
View Answer
Unlock this answer now
Get Access to more Verified Answers free of charge
Q50: Another article in the October 7, 2007,
Q51: In a recent study, researchers followed 104,000
Q52: Consider the following dotplots of (hypothetical) ages
Q53: Suppose an instructor wants to investigate whether
Q54: An April 9, 2002, news release from
Q55: In a study reported in the
Q56: Suppose the observational units in a study
Q57: On June 4-24, 2007, the Gallup
Q59: Studies conducted at elementary schools have shown
Q60: a. Does taking a larger sample help
Unlock this Answer For Free Now!
View this answer and more for free by performing one of the following actions

Scan the QR code to install the App and get 2 free unlocks

Unlock quizzes for free by uploading documents