The 2001_2002 National Health and Nutrition Examination Survey asked people over the age of 60 how many close friends they had. The answers for the 1840 respondents appear in the following table. (For example, 82 people answered that they have 0 close friends, and 13 people answered that they have 50 close friends, and nobody answered that they have 18 close friends.)
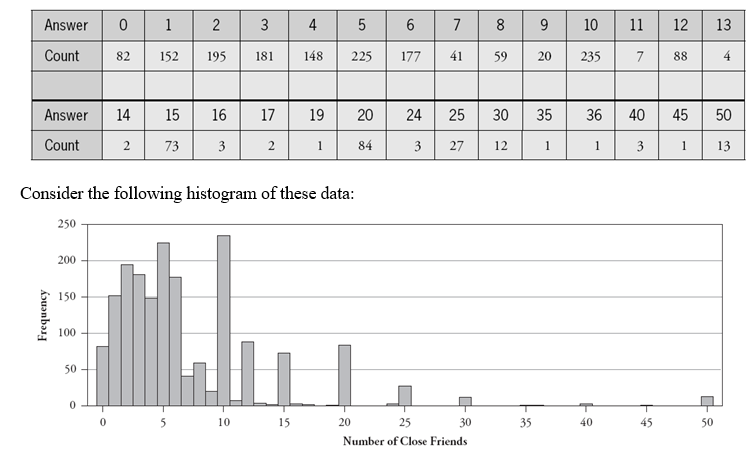
a. Write a paragraph describing key features of this distribution.
b. Determine the median of these data.
c. Would you expect the mean to be greater than the median, less than the median, or about the same as the median? Explain briefly without calculating the mean.
Correct Answer:
Verified
View Answer
Unlock this answer now
Get Access to more Verified Answers free of charge
Q41: The following side-by-side stemplot displays the total
Q42: The following side-by-side stemplot displays the total
Q43: An instructor conducted an in-class experiment where
Q44: In a recent study, researchers followed 104,000
Q45: The following dotplot displays the salaries
Q47: Suppose Mary records the ages of people
Q48: Construct a hypothetical example of ten exam
Q49: In a recent study, researchers purchased 40
Q50: Suppose Ben records the noon temperature in
Q51: The following histogram displays the life expectancies
Unlock this Answer For Free Now!
View this answer and more for free by performing one of the following actions

Scan the QR code to install the App and get 2 free unlocks

Unlock quizzes for free by uploading documents