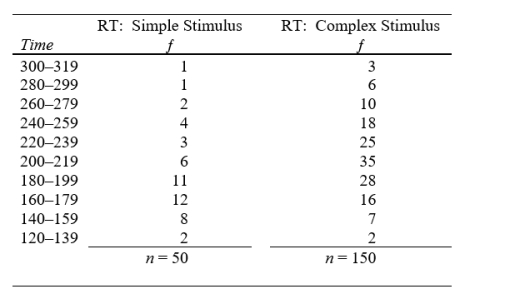
A human factors psychologist is engaged in a program of research to improve the readability of cockpit instrument panels. The data give the results of one of her experiments using 200 Air Force pilot trainees as subjects. The reaction time (RT) to simple and complex stimuli is measured in milliseconds. Plot the percentage frequency polygons for the two sets of data. Put them both on the same graph. Compare the two distributions and record your conclusions.
Correct Answer:
Verified
View Answer
Unlock this answer now
Get Access to more Verified Answers free of charge
Q2: The following is the distribution of complaints
Q3: Describe the similarities of and differences between
Q4: In a university, male psychology majors are
Q5: Construct a histogram and frequency polygon for
Q6: (a) Plot the frequency polygon for the
Q8: Construct a cumulative percentage frequency distribution of
Q9: Suppose the frequency curve below is based
Q10: In general, a graph
A) tells less than
Q11: The Y-axis is also called the
A) abscissa
B)
Q12: It is customary to draw the graph
Unlock this Answer For Free Now!
View this answer and more for free by performing one of the following actions

Scan the QR code to install the App and get 2 free unlocks

Unlock quizzes for free by uploading documents