Use the following
According to ESPN.com, the average number of yards per game for all NFL running backs with at least 50 attempts in the 2011 season was 49 yards/game. A sample of 20 running backs from the 2011 season averaged 46.54 yards/game.
-Two boxplots are shown. One boxplot corresponds to the yards/game for a random sample of n = 20 running backs. The other boxplot represents the values in a sampling distribution of 1,000 means of yards/game for samples of size n = 20.
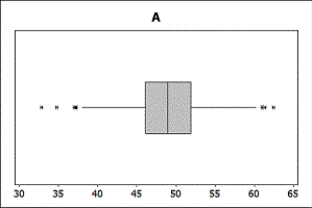
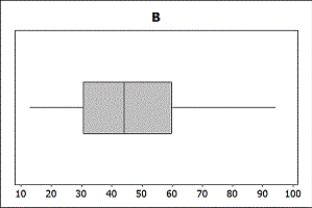 Which boxplot represents the sample? Which boxplot represents the sampling distribution? Briefly explain how you know.
Correct Answer:
Verified
View Answer
Unlock this answer now
Get Access to more Verified Answers free of charge
Q39: Use the following
According to U.S. Census
Q40: Use the following
According to U.S. Census
Q41: Use the following
According to U.S. Census
Q42: Use the following
According to ESPN.com, the
Q43: Use the following
According to ESPN.com, the
Q45: Use the following
Identify if each of
Q46: Use the following
Identify if each of
Q47: Use the following
Identify if each of
Q48: Use the following
Identify if each of
Q49: Use the following
Identify if each of
Unlock this Answer For Free Now!
View this answer and more for free by performing one of the following actions

Scan the QR code to install the App and get 2 free unlocks

Unlock quizzes for free by uploading documents