Each of the variables displayed in the histograms below has a mean of 14.5, a range of 8, and 59 observations. Rank the three variables according to their standard deviations, from the smallest to the largest.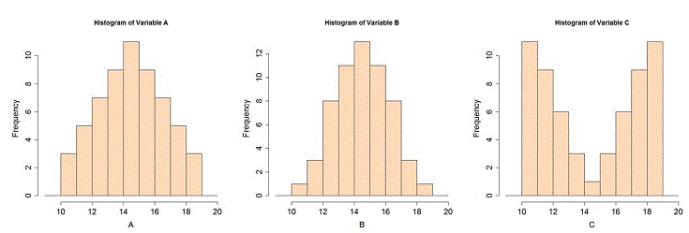
A) A, B, C
B) B, A, C
C) C, B, A
D) A, C, B
Correct Answer:
Verified
Q25: Use the following
Use this dataset
Q26: Use the following
Use this dataset
Q27: Use the following
Use this dataset
Q28: Use the following
Use this dataset
Q29: Use the following
Use this dataset
Q31: Use the following to answer questions :
One
Q32: Use the following to answer questions :
One
Q33: Use the following to answer questions :
One
Q34: Use the following to answer questions :
One
Q35: Use the following
The distribution of waiting times
Unlock this Answer For Free Now!
View this answer and more for free by performing one of the following actions

Scan the QR code to install the App and get 2 free unlocks

Unlock quizzes for free by uploading documents