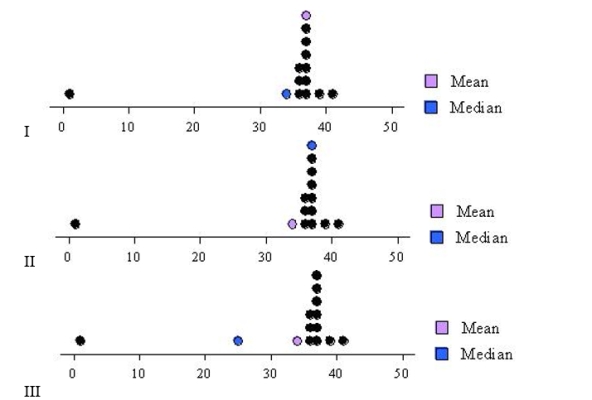
In a period of twelve years, the record low temperatures ( F) in Los Angeles CA were:
 Find the dot diagram that corresponds to these data.
Correct Answer:
Verified
Q15: Use the stem-and-leaf display to construct a
Q16: The table below shows the fastest race
Q17: Calculate the mean and median of the
Q18: Calculate the mean and median of the
Q19: Calculate the mean and the median of
Q21: Calculate the quartiles of the following data
Q22: Calculate the third quartile. Q23: The second quartile of a data set Q24: The second quartile of a data set Q25: Find the 10th percentile. ![]()
![]()
Unlock this Answer For Free Now!
View this answer and more for free by performing one of the following actions

Scan the QR code to install the App and get 2 free unlocks

Unlock quizzes for free by uploading documents