The figure below shows the mass to charge ratios of two pathogenic Neisseria sp. The molecule being measured is ________ and the technique being used is ________. 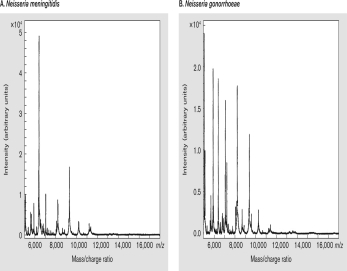
A) protein; riboswitch sensor
B) protein; MALDI-TOF-MS
C) DNA; riboswitch sensor
D) DNA; MALDI-TOF-MS
E) RNA; riboswitch sensor
Correct Answer:
Verified
Q21: RNA sensors can be used to detect
Q23: Which of the following organisms falls within
Q27: The figure shown below is a picture
Q29: Symptoms of headache, fever, stiff neck, and
Q31: As point of care (POC) tests are
Q33: An antigen-capture ELISA could be looking for
Q35: Fluorescent antibody staining works well for clinical
Q36: Lowenstein-Jensen agar is used to culture _
Q38: Point-of-care diagnostics are advantageous for all of
Q40: A serum antibody ELISA would be looking
Unlock this Answer For Free Now!
View this answer and more for free by performing one of the following actions

Scan the QR code to install the App and get 2 free unlocks

Unlock quizzes for free by uploading documents