The graph shown below diagrams the number of cases of a disease versus time. The high peak near the right-hand side would be considered a(n) 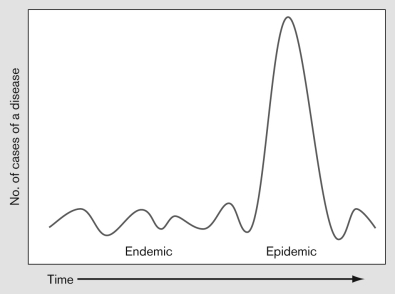
A) prevalence.
B) incidence.
C) endemic.
D) epidemic.
E) pandemic.
Correct Answer:
Verified
Q46: Describe the general protocol used to diagnose
Q47: The following are all concerns of the
Q52: Gaëtan Dugas is frequently referred to as
Q58: Looking at the laboratory results presented here,
Q60: Which of the following criteria is NOT
Q61: The clinical microbiology laboratory just received a
Q62: Compare and contrast the use of the
Q63: Compare and contrast the handling of rabies
Q64: As a disease detective investigating an outbreak
Q72: Describe what the One Health Initiative is
Unlock this Answer For Free Now!
View this answer and more for free by performing one of the following actions

Scan the QR code to install the App and get 2 free unlocks

Unlock quizzes for free by uploading documents