
Examine the figure below.If each sugar molecule represents a percentage point of sugar dissolved in the solution,what change would you expect to see in the solution level over time and why? 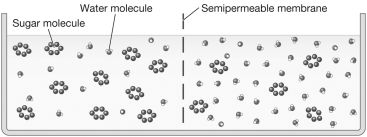
A) The solution level on the left side of the figure would rise while the solution level on the right side of the figure would decrease.This is because the solution on the left side of the figure is hypertonic while the solution on the right side of the figure is hypotonic.
B) The solution level on the left side of the figure would decrease while the solution level on the right side of the figure would rise.This is because the solution on the left side of the figure is hypertonic while the solution on the right side of the figure is hypotonic.
C) The solution level on the left side of the figure would decrease while the solution level on the right side of the figure would rise.This is because the solution on the left side of the figure is hypotonic while the solution on the right side of the figure is hypertonic.
D) There will be no net movement of water because the solutions are isotonic.
Correct Answer:
Verified
Q4: If the concentration of sugar molecules in
Q5: The plasma membrane of some white blood
Q6: From what substance do liposomes spontaneously form
Q7: You are in lab attempting to prepare
Q11: Which of the following types of organisms
Q12: Compare and contrast the nuclear envelope and
Q13: Some antibiotics used to treat bacterial infections
Q16: A screen door allows breezes to enter
Q17: Adenine (A),thymine (T),guanine (G),and cytosine (C)are the
Q20: Cells naturally,without using energy,respond to changes in
Unlock this Answer For Free Now!
View this answer and more for free by performing one of the following actions

Scan the QR code to install the App and get 2 free unlocks

Unlock quizzes for free by uploading documents