
This graph shows which of the following? 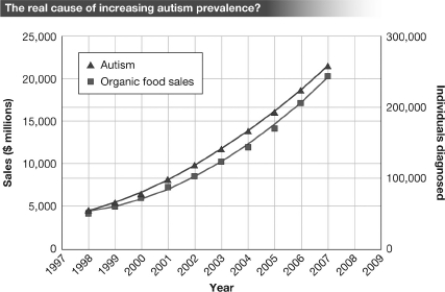
A) There is a positive correlation between the sale/consumption of organic food and the number of individuals diagnosed with autism between 1998 and 2007.
B) The increased consumption of organic food has led to an increase in the rate of autism between 1998 and 2007.
C) Consuming organic food causes autism.
D) There is positive evidence that a cause-and-effect relationship exists between the consumption of organic food and the development of autism.
Correct Answer:
Verified
Q33: When determining whether or not a claim
Q34: Thomas's foot began to swell after he
Q35: Sue has twin baby boys and is
Q36: A scientific paper that combines results from
Q37: The fact that the onset of autism
Q37: Which of the following is NOT a
Q40: A researcher noticed that as the prevalence
Q58: Which of the following would NOT be
Q66: A large biotech company would like to
Q71: What is a first step an individual
Unlock this Answer For Free Now!
View this answer and more for free by performing one of the following actions

Scan the QR code to install the App and get 2 free unlocks

Unlock quizzes for free by uploading documents