
This figure,based on data collected by The National Institute of Allergy and Infectious Diseases,graphically illustrates that a disease is less likely to spread to vulnerable members of a population if most of the population is immunized against the disease.This phenomenon occurs because 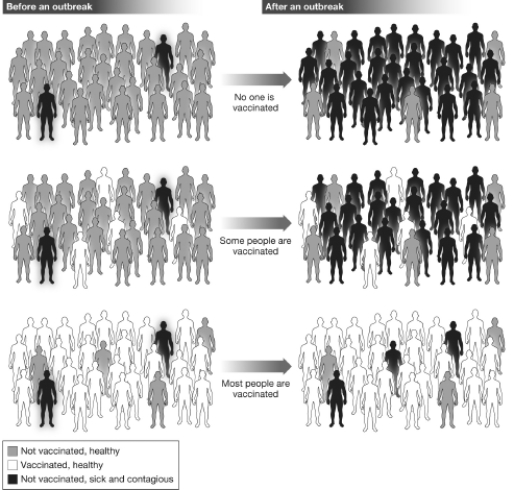
A) when fewer individuals in the population are likely to become infected,fewer people are able to spread the disease,and the vulnerable members of the population are less likely to come in contact with contagious individuals.
B) if more individuals in the population become infected,fewer people are able to spread the disease,and the vulnerable members of the population are less likely to come in contact with contagious individuals.
C) if more individuals in the population become infected,more people are able to spread the disease,and the vulnerable members of the population are less likely to come in contact with contagious individuals.
D) when none of the population is immune to the disease,no one will contract the disease and therefore pass it on to the vulnerable members of the population.
Correct Answer:
Verified
Q42: Peer-reviewed scientific journals,technical reports,conference proceedings,and dissertations are
Q50: A statement about how the world works
Q51: This figure,based on data collected by The
Q52: You search the Internet for information regarding
Q54: Which of the following situations might present
Q55: Scientific studies that compare patients with a
Q57: According to the Centers for Disease Control
Q58: You discover that a holistic treatment called
Q59: Evaluate the following and determine whether or
Q60: MATCHING
Indicate below which texts are examples of
Unlock this Answer For Free Now!
View this answer and more for free by performing one of the following actions

Scan the QR code to install the App and get 2 free unlocks

Unlock quizzes for free by uploading documents