Multiple Choice

Figure 8.5
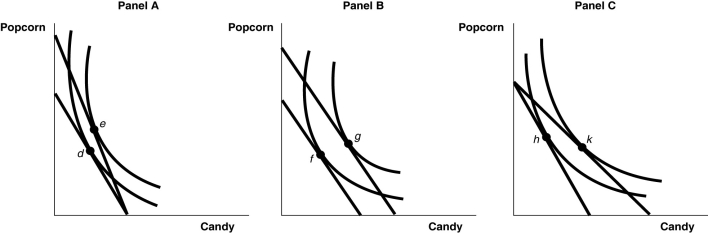
-Refer to Figure 8.5.Which diagram demonstrates a decrease in total utility following an increase in the price of candy?
A) the movement from e to d in Panel A
B) the movement from g to f in Panel B
C) the movement from k to h in Panel C
D) none of the above
Correct Answer:
Verified
Related Questions
Q134: A fair number of people buy expensive

